Planned training:
April 16
April 24
May 6
June 10 EN
June 11
July 16
August 13
September 10
October 15
November 12
December 10
Price:
2400€
Funded by the Employment Service
![]()
![]()
![]()
![]()
Blended learning: study and from home ir from the class. Ability to change the format during training
Intensity: 160 hours
(all hours live, in real time with a lecturer)
Runtime: 10 weeks - 40 sessions
Time: 4 times a week, from 18.00:22.00 p.m. to 13:00 p.m. or from 17:00-XNUMX:XNUMX

Course repetition: possibility to return to repeat the course for FREE during the year

100% financing option for working and non-working + scholarship up to €1260
The entire amount is financed by the EMPLOYMENT SERVICE. This training is suitable for all working people who want to understand and learn what data is, how to access and analyze it, what the basis...
What will I learn?
What does a data analyst and data scientist do?
What are the data? Where and how are they stored?
How to access and analyze data?
What are the main working tools of a data analyst?
What after training?
After these trainings, students are invited to continue participating in the school's mentoring program free of charge: for a whole month, if questions arise, they can both contact the school's lecturer and use the school's classrooms for independent study.
For our students who want to start a career in the IT field, the Career Center will help them search for an internship or job, provide all the necessary information about job interviews, help them prepare a strong and attractive CV and LinkedIn profile, which will distinguish you from other candidates during the selection process. We constantly share job and internship offers and advise on all issues related to employment. You will not be alone during your job search, our professional team of consultants and mentors will provide comprehensive assistance to achieve your goal of successfully starting a career in the IT field.
Vilnius Coding School cooperates with more than 250 companies - partners that can provide career opportunities for graduates of our school. Even 85 percent everyone who has finished school and applied for a job is successfully employed.
Training program
SQL
Database structure:
● Table schemas/architecture
● Creating/editing/deleting tables
● Creating/editing/deleting entries in the table
Extracting data from databases:
● Query syntax
● Data filtering
● Basic functions in queries
● Connecting tables (relationships between them)
● Internal requests
TYPES OF DATA
TABLEAU or POWER BI
Accessing and managing data using Tableau prep / Power Query:
● Changing and cleaning data types
● Creating new variables
● Joining tables and aggregating data
Visual familiarization with the data:
● Creating graphs
● Choosing the right visualization
● Spotting insights and trends
Detailed analysis and creation of new variables:
● Creation of new calculated fields, creation of sets and groups (calculated fields) (Tableau)
● Calculation of new tables and creation of parameters (table calculation) (Tableau and Power BI)
● Creating filters adapted to different data types (Tableau)
● Creating tables, columns, measures using the DAX language (Power BI)
Summarizing the obtained results using the dashboard and stories/bookmarks:
● Dashboard aesthetics
● Choice of colors
● Targeted data mapping
Fundamentals of programming language syntax:
● Data structures: string, integer, float, boolean, list, set, dictionary
● Conditions: if / elif / else
● Loops: for loop, while loop
● Functions: simple and anonymous. Fitting functions to data. Introduction and work with the most popular data analysis libraries (numpy, pandas, math)
● Theoretical introduction to numpy and math
● Practical work with the pandas library: data reading, transformation, management and preparation for analysis
PYTHON BASICS AND INTRODUCTION TO STATISTICAL ANALYSIS
Data visualization:
● Matplotlib: data visualization using plot, hist, bar, scatter. Configuring graphs
● Seaborn: data representation, stylistics. Statistical models (theoretical basis, practical application with the scikit-learn library)
● linear regression
● clustering
● choice trees
FINAL PROJECT, DELIVERY AND BILL
1. Communication skills
- Active listening
- Effective communication
- Dealing with difficult customers
- Creating a connection
2. Problem solving strategies
- Problem analysis and diagnostics
- Determination of solutions
- Troubleshooting methods
- Root cause analysis of the problem
- Latest problem solving technologies
- How to get feedback from managers
- Professional development
3. Time management and organization
- Prioritization of tasks
- Workload management
- Delegation and collaboration
4. Emotional intelligence
- Understanding and managing emotions
- Empathy and compassion
- Conflict resolution
- Stress management
5. How to learn more and faster and less
to forget
- 5 minute brain exercise
- Clear your "mental fog" with these 5
delicious brain foods - Learn a powerful memory technique to
you would never miss a meeting
Vilnius coding School CERTIFICATE
strong evidence that you are ready career ITEM!
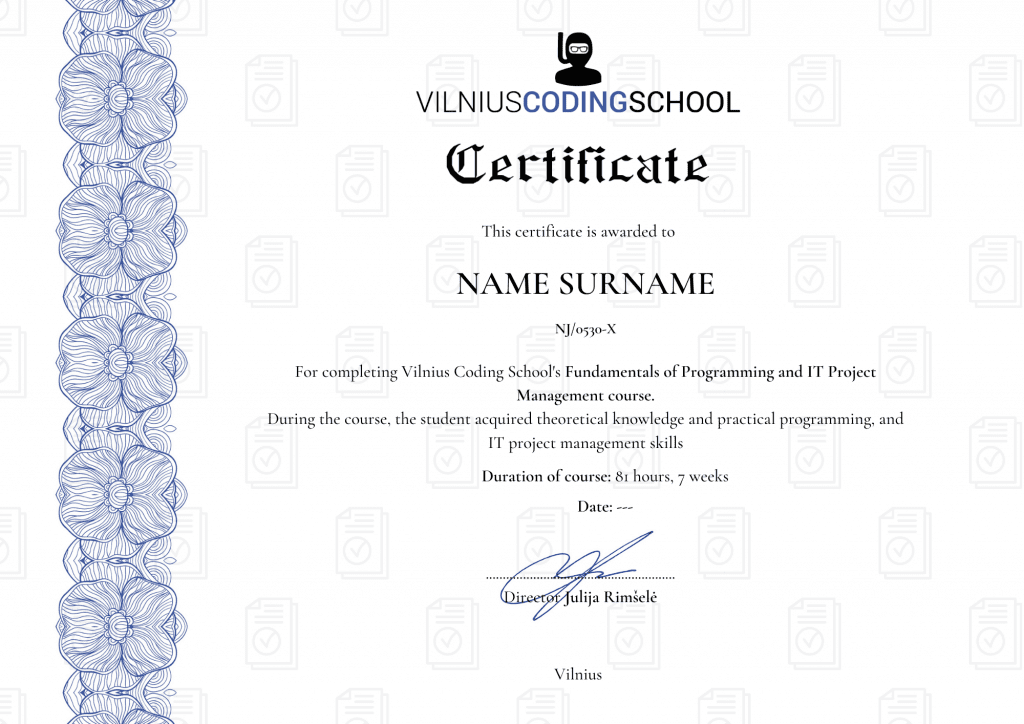
![]() Official certificate approved by the Education and Science Register
Official certificate approved by the Education and Science Register
![]() Recognized by the strongest Lithuanian and international companies
Recognized by the strongest Lithuanian and international companies
![]() It proves that you have studied with the best specialists in your field
It proves that you have studied with the best specialists in your field
![]() Reliable proof of acquired skills
Reliable proof of acquired skills
![]() Certificate issued by a company developing transparent activities in Lithuania
Certificate issued by a company developing transparent activities in Lithuania
![]() This certificate confirms that you attended at least 95% of the course lectures in real time with the lecturer, completed and defended the final thesis
This certificate confirms that you attended at least 95% of the course lectures in real time with the lecturer, completed and defended the final thesis
Course lecturers


MANTAS V.


JOSEPH Z.

Paul M.